
This document captures the PQRS Photovoltaic (PV) glint and glare assessment for aviation and terrestrial receptors; providing an independent implementation inspired by SGHAT methodology and associated FAA guidance (also see References) as well as South African Aviation Regulation Compliance
Also see the rules and documentation covering South African G&G Policies: https://pqrs-online.com/aviation-glint-and-glare-south-africa-and-the-faa/
1. Purpose and intended use
This methodology defines how the PQRS Glint and Glare software program performs glint and glare assessments for PV installations in and around airports and air traffic environments. The objective is to quantify:
- When glare can occur (time-of-year and time-of-day)
- Where glare can be observed (at defined receptors)
- Potential ocular impact category based on established hazard boundaries (Green/Yellow/Red)
- FAA policy adherence summaries where required — one report, with FAA 2021 (ATCT) as the primary aviation outcome, and any FAA 2013 flight-path colour screening retained only as a legacy / informational appendix note (not a co-equal PASS/FAIL verdict)
This methodology produces informational results intended to support design decisions and stakeholder review. It is not an FAA approval process and does not replace authority requirements.
2. Methodology position and transparency
PQRS builds and operates its own glint and glare software (white-label capable). The calculation approach is inspired by publicly published SGHAT methodology and related FAA research.
Results are always PQRS-calculated based on mathematical principles.
Every analysis deliverable includes:
- The Workspace version and the methodology version
- The full set of input parameters used
- A standard assumptions and limitations section
3. Core concepts and object model
The workflow is structured using three core objects:
- Project: A container for related assessments in a single timezone offset and common units.
- Site Configuration: The atomic unit of analysis. A site configuration contains one or more PV arrays (and optionally other reflective surfaces) plus receptors and analysis settings.
- Glare Analysis Run: An annual simulation over a site configuration that produces results, exports, and reports.
Site configurations may be cloned to test alternate module tilts/orientations without overwriting the baseline design.
4. Inputs
4.1 Site and time inputs
- Latitude / Longitude (WGS84 decimal degrees) for each component vertex and receptor point
- Timezone offset from UTC/GMT (e.g., UTC+2, UTC−5)
- Time step (minutes). Aviation assessments typically require 1-minute time steps.
- Minimum sun altitude (degrees). Glare is ignored when the sun is below this altitude.
4.2 Solar irradiance inputs (DNI)
- Peak Direct Normal Irradiance (Peak DNI) (W/m²), typically ~1000 (W/m²) for clear-sky midday
- DNI variability:
- Fixed: use Peak DNI at every timestep
- Variable: scale Peak DNI using a clear-day profile tied to sunrise/noon/sunset timing
4.3 PV array geometry and configuration
Each distinct PV installation is modeled as a PV array component with:
- A contiguous planar polygon footprint (3–80 vertices) defined by:
- latitude, longitude
- ground elevation
- height above ground (or total elevation)
- A module configuration, independent of vertex elevations:
- Fixed-mount: module tilt and module azimuth (orientation)
- Tracking (phase-2+): single-axis or dual-axis tracking parameters
If a footprint is non-planar or highly concave, the recommended practice is to partition the PV system into multiple PV array footprints for accuracy and traceability.
4.4 Optical model inputs (reflectivity and scatter)
PQRS models PV glare as predominantly specular reflection with additional scatter represented by slope error:
- Surface material presets: selects measured/characterized reflectance behavior
- Reflectivity mode:
- constant reflectivity, or
- reflectivity varying with incidence angle (piecewise fit functions)
- Slope error (mrad): proxy for surface scatter/beam spread
4.5 Observer (eye) parameters
Analyses use standard ocular parameters to compute hazard metrics:
- Ocular transmission coefficient
- Pupil diameter
- Eye focal length
- Sun subtended angle (default ~9.3 mrad)
These parameters materially influence ocular hazard classification and is recorded and, where required, could be additionally sensitivity-tested.
5. Receptor types
5.1 Observation Point (OP) receptor
An OP receptor represents a stationary observer at a single point:
- latitude, longitude
- ground elevation
- height above ground
For aviation work, an OP receptor may be flagged as ATCT (air traffic control tower cab). FAA-style policy summaries evaluate ATCT receptors separately.
5.2 2-mile Flight Path (FP) receptor
An FP receptor represents an aircraft on approach along a straight path to a runway threshold:
- threshold point and a 2-mile point
- direction (bearing), glide slope, threshold crossing height
- field-of-view (FOV) filtering (azimuthal and downward viewing angles) when required
FP receptors remain useful for design review and stakeholder context. Under FAA 2021, the primary policy emphasis is the ATCT cab; 2‑mile flight-path colour screening from the 2013 interim policy is reported only as an informational note, not as the primary aviation outcome.
5.3 Route receptor (terrestrial and non-standard tracks)
A Route receptor is a polyline representing observers moving along a continuous route (roads, rail, custom tracks):
- polyline vertices (2–30)
- one-way vs two-way travel
- azimuthal view angle and downward view angle filtering
Route receptors are commonly used for terrestrial glare screening. Aviation authorities may require FP receptors rather than route receptors for standard approach evaluations.
6. Annual simulation process (overview)
The analysis is performed at each time step throughout the year (or the defined analysis period). At each time step:
- Compute sun position (sun azimuth and altitude; sun unit vector) using site location and time.
- Compute PV module normal vector from fixed-mount configuration or tracking model.
- Compute reflected sun vector from the sun vector about the PV normal (specular reflection).
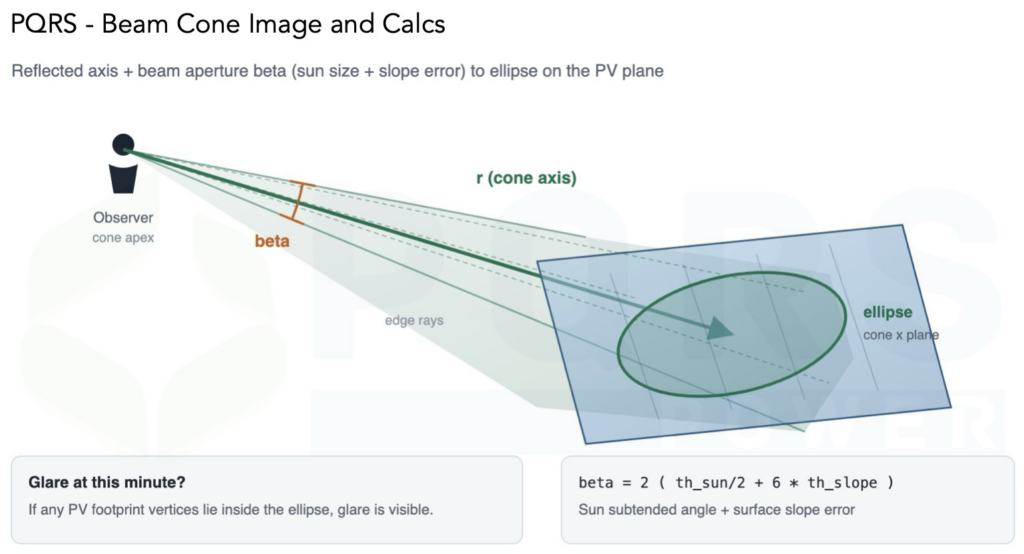
- Model beam spread based on sun angular size and slope error to form a glare “beam” envelope.
- Determine glare occurrence at each receptor:
- Whether the reflected beam intersects the receptor line-of-sight and FOV constraints.
- If glare occurs, compute hazard-relevant metrics:
- Subtended source angle (effective glare spot size as viewed by the receptor)
- Retinal irradiance (energy per unit area at retina) derived from DNI, reflectance, and eye parameters
- Classify the minute into an ocular hazard category (Green/Yellow/Red) using established hazard boundaries.
Results are aggregated into:
- Annual minutes per hazard category per receptor
- Annual minutes per hazard category per PV array (and optionally per receptor type)
- Policy adherence summaries where required
7. Ocular hazard classification (Green / Yellow / Red)
PQRS uses the standard hazard plot concept:
- (x)-axis: subtended source angle (rad)
- (y)-axis: retinal irradiance (normalized/consistent with reference boundaries)
Hazard zones are treated as approximations and visual aids. Human ocular outcomes are continuous rather than discrete; the plot is used to provide a consistent decision framework and reporting language.
8. FAA reporting logic
PQRS issues one analysis report. Within that report, policy-era results are not presented as equal PASS/FAIL cards.
| Check | FAA 2021 (current / primary) | FAA 2013 (interim / legacy) |
| ATCT — no glare of any kind | Required — primary aviation outcome | Also required historically |
| Flight path — no yellow/red on 2‑mile approach | Not required | Required under 2013 |
8.1 Primary outcome (FAA 2021)
The executive findings lead with:
- ATCT — no glare of any kind: PASS if no glare of any kind is predicted at ATCT receptor(s); FAIL otherwise.
- If no ATCT receptor is defined, the ATCT check is reported as PASS with a note that no ATCT receptor was modelled.
This is the result that should be read as the primary aviation outcome for current FAA-style framing.
8.2 Legacy note (FAA 2013 flight-path colour screen)
The superseded 2013 interim policy also screened for no yellow or red glare on 2‑mile final approach paths. That colour test is not required under FAA 2021.
PQRS still computes flight-path glare where FP receptors are defined, and may record a short appendix note describing whether yellow/red glare was predicted. That note:
- must not use a prominent PASS/FAIL card alongside the 2021 ATCT result
- must state clearly that it is informational / legacy and not the primary aviation outcome
- exists so stakeholders who still ask for the older framing have a transparent record
Presenting 2013 flight-path colour results as a co-equal FAIL can be misread by authorities as a failure under current (2021) policy when the ATCT check actually PASSes. PQRS reporting deliberately avoids that ambiguity.
FAA does not endorse a specific analysis tool; results are informational. Airport sponsors remain responsible for Form 7460‑1 assertions where that process applies.
9. Quality, repeatability, and versioning
Each run must record:
- Workspace version (SemVer)
- methodology version
- full input set (including receptor definitions and eye parameters)
- time step and timezone offset
If any randomized sampling is used in a calculation path, the run must also record the random seed. Where feasible, PQRS prefers deterministic computation for repeatability.
10. Assumptions and limitations (standard disclosures)
The following are always disclosed in PQRS outputs:
- Times are reported in standard time; DST handled via explicit note/offset.
- Simplified geometry; gaps/support structures/variable heights are not modeled in detail.
- Results do not automatically include obstacles/obstructions unless explicitly enabled (and some authorities may disallow obstruction mitigation).
- DNI modeling assumes clear-sky conditions and/or a clear-day scaling profile; real weather differs.
- Partitioning PV footprints affects the maximum subtended source angle; users should not partition purely for convenience if it reduces physical glare spot size.
- Hazard boundaries are approximations; actual ocular impact outcomes are continuous.
- Plot locations and glare-spot displays are approximate.
11. Deliverables
Also see the South African Scope on Glint and Glare Analysis
Deliverables depend on scope, but typically include:
- Analysis report with FAA 2021 ATCT as the primary aviation outcome, and an optional FAA 2013 flight-path colour appendix note (informational only)
- Optional exports (phase-2+): detailed per-timestep result files, luminance outputs, optimization tables
12. References (canonical sources)
- SGHAT Technical Reference Manual (SAND2014-18360 O, March 2015): See Sandia glare-tools hub for official documentation and licensing channels.
- SGHAT User’s Manual v3.0 (Dec 6, 2016): See Sandia glare-tools hub for official documentation and licensing channels.
- FAA Final Policy (2021-09862) official PDF: https://www.govinfo.gov/content/pkg/FR-2021-05-11/pdf/2021-09862.pdf
- FAA Interim Policy (2013-24729 / 78 FR 63276) official PDF: https://www.govinfo.gov/content/pkg/FR-2013-10-23/pdf/2013-24729.pdf
- Rogers et al. (2015) DOT/FAA/AM-15/12: https://www.faa.gov/sites/faa.gov/files/data_research/research/med_humanfacs/oamtechreports/2015
Talk to us
We can write the glint and glare study for your tender or ATNS pack, or switch the calculator on for you. Call or WhatsApp +27 82 322 2601, or use the form. Email is [email protected].